OEC at 12
The Physicist, the Designer, the Engineer and the Galileos of Complexity Behind the OEC
The Observatory of Economic Complexity (the OEC) is turning 12 years old this year. It’s a significant milestone for something that I saw come together when I was briefly a fellow at the MIT Media Lab. Back then an unconventional way of thinking about economics became a platform for observing global commerce in a fundamentally new way. An unlikely team of builders was convinced that making things complex could be more useful for designing economic policy than making things simple. Back then what associate professor Cesar Hidalgo and his team were doing looked about the same as every other team of brainy sorcerers at the Media Lab in their messy glass offices full of strange looking digital gadgets and oddly shaped prototypes. The Media Lab 20 years ago was a cross between a daycare center full of toys and a TED conference packed with geniuses.
I had followed Hidalgo after losing touch with MIT years ago and knew that the OEC was thriving in 2023. I was surprised and delighted when I was asked to write the story of its birth and growing impact. The members of the OEC team and their parent company Datawheel told me they were far too busy keeping up with the demands of their creation to do it themselves. They asked if I could put together a document in a couple of days that would serve as an unofficial history of the OEC on the occasion of its 12th birthday. I felt like I was abruptly back at the lab pulling an all-nighter.
I set to work gathering all the information I could from a team spread across three continents, that spoke at least five languages and was part of a seasoned start-up that, I quickly learned, has never received a dime from narrow horizon venture capitalists. Co-founder Cesar Hidalgo, today a professor in Toulouse and Budapest, assured me that unusual geography and language issues would be no problem. “The world runs on bad English,” he said and made no apology for the OEC’s slow and steady growth for more than a decade. “We have never had to make our PowerPoint pitch to investors. And we might not even be good at that.”
They are clearly good at something. The OEC today constitutes validation of a radical new vision of how to understand economies that didn’t really exist at the beginning of this century. Best of all, is the unlikely tale of how the OEC began and grew to be a vital part of the discourse for developing economic strategy for governments all over the world.
The story begins with Cesar Hidalgo coming of age, just as Chile’s uncountable Andean peaks and clear skies were becoming the global center for astronomical research. He fell in love with physics and telescopes, and as a young scientist was fascinated, as he describes it, “with embracing different ways of seeing things.”
In college he found exploring large datasets similar to exploring distant stars and galaxies, and as elusive as subatomic particles. “I would have gigabytes and gigabytes of data on my hard drive, and I would use them to make a point that would be publishable in a scientific journal.” But most of the data he used would not make it into the figures he published in papers. It would stay behind in the hard-drive of the computers where the calculations had been made. So he began exploring with data visualization. Inspired by pioneers like Hans Rosling, Cesar’s first experiments in online data visualization focused on public health. “The first platform that I did, which unfortunately is not online anymore, was a platform to visualize the network of human diseases. A network allowing people to see which diseases tended to go with each other; if congestive heart failure was likely to occur with diabetes.”
By 2010, in the midst of the worst global financial crisis in 80 years Cesar was recruited by MIT. At the Media Lab, he was allowed to hire two grad students, “no questions asked.” So, professor Hidalgo chose Alex Simoes from Northeastern University, even though not many NEU grads make it across the river to MIT. Alex was an unpublished computer scientist with a graphic design background and an avid reader. Almost immediately Alex and Cesar realized they were more than just an ordinary student/mentor duo. “Cesar and I work really well together and I think we really respect each of our boundaries and expertise.” Alex says their vast differences immediately established a culture of contrasts and pure chemistry. “That he comes from this very rich, deep academic background and I come from more of an engineering, let's get shit done background. We collaborate really well.”
At MIT, Cesar was at a turning point. He had developed the idea of Economic Complexity and had shown how nations and regions that exported the greatest amount of the most complex products, products that required specialized expertise, had more paths to prosperity for their people and were more stable than countries that relied on a few products. Economies based on oil, lithium or copper might be rich but they are less complex than economies based on transportation, electronics, or heavy machinery. Complexity, the data was showing, created resilient economies that on average grew faster. And even early on, the complexity concept was attracting offers from economists and government officials who read Hidalgo’s papers. They wanted to pay him to analyze their economies, but Hidalgo “didn't want to go into development consulting.” He “wanted to work on new papers. Not repeat what I had already done for a particular case. You know, if you discovered the law of gravity with apples you don't want to, you know, try to repeat the law of gravity for oranges and watermelons.”
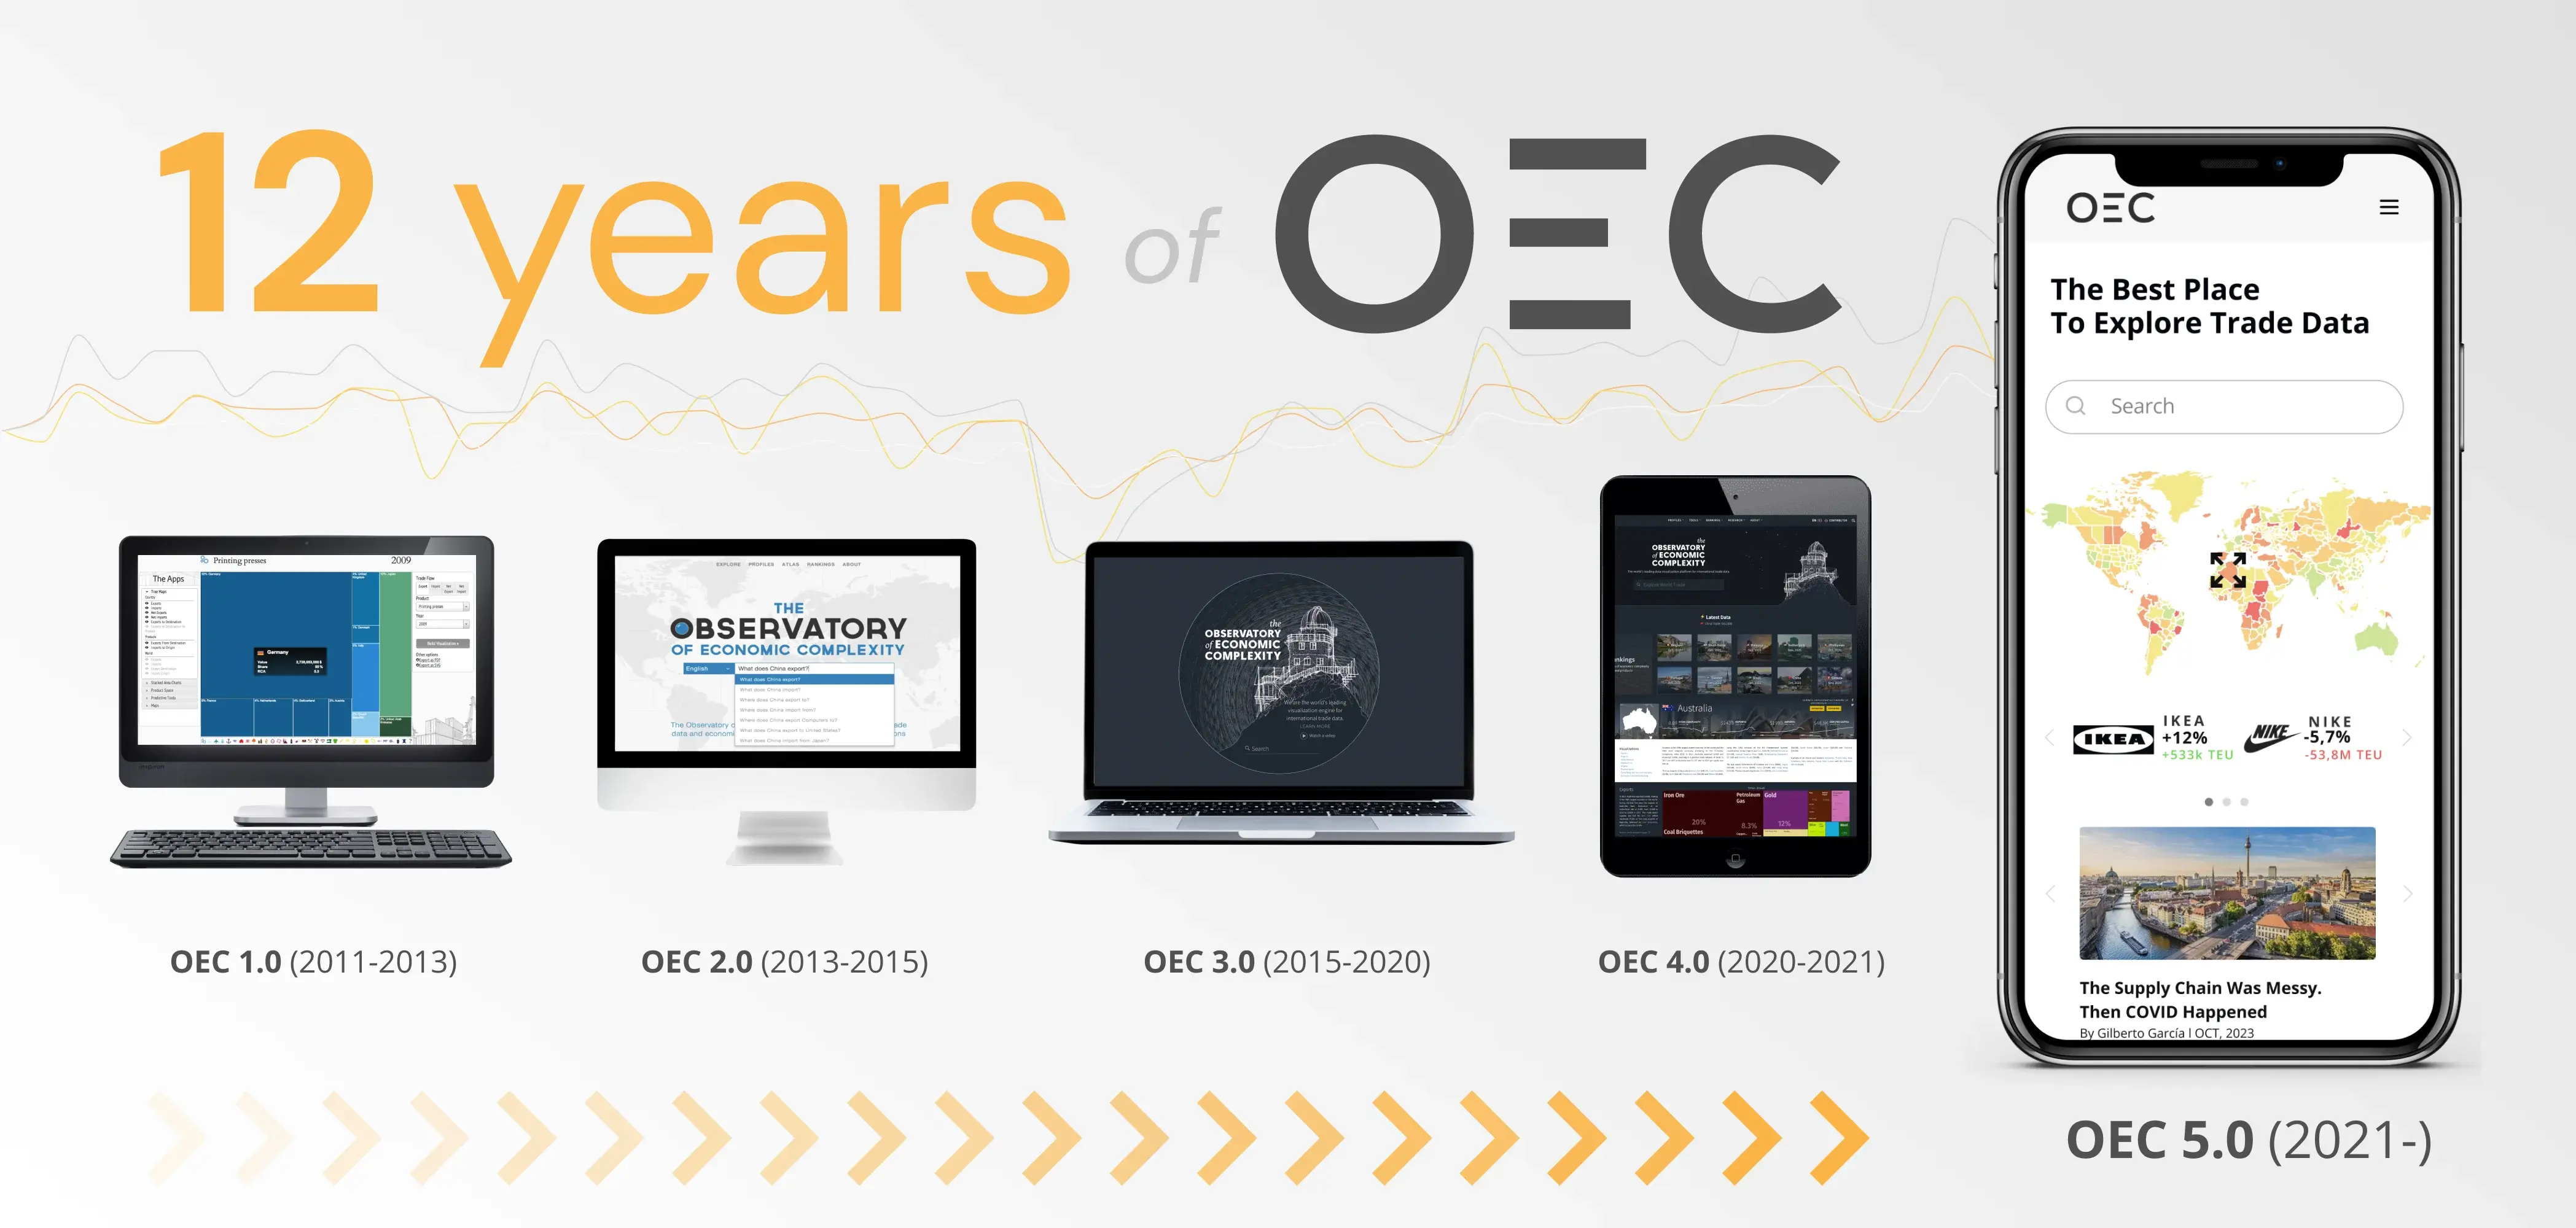
What interested Cesar was creating a web based tool for users to explore world trade data on their own. He assigned the creation of this app to Alex Simoes, and it became his master’s thesis. The project became the Observatory Of Economic Complexity. It was just like the telescopes back home in the Andes, but based on “data-scopes” pointed at the vast universe of trade data. And like that, the OEC was born. Alex, the “get-shit-done” engineer, went to work. He was done in less than a year and in 2011 the OEC was rolled out with a richly illustrated companion book: “The Atlas of Economic Complexity.”
The main triumph in those early years was for Alex to make very raw and hard to access trade data visually searchable in real time. Harmonizing the data deep in the trenches and creating tools to bring it alive was hard work and a labor of love for Alex. “Getting this data to be instantaneously available was a huge win for me,” Alex says with the enthusiasm of an archeologist finding Atlantis. Even though the first version of the OEC was primitive, there was interest and web traffic right away. “It would not even allow you to see bilateral data. You could see the exports of Argentina or France or Brazil, but you couldn't even see where these goods were being exported to.” Cesar recalls.
Design and building of upgrades began from the start and by 2012 functionality was improving quickly. Dave Landry, an experienced designer and entrepreneur joined the team and focused his talents on better visualizations and user-friendly software tools. But the OEC was still difficult to find on the traditional document-centered web. The visualization and explorer tools required clicks and dropdown menus. During a meeting with a team from Google, across the street from MIT, someone made the suggestion that they should try making “a page that “presented the data in the HTML directly. And we did that,” Cesar recalls. The implications of this would be enormous but it wasn’t until after Alex graduated and Cesar was in demand, traveling and making presentations using the OEC that the real product value of what would become the company Datawheel became clear. “I was in Colombia, giving a talk for the Banking Association, when I started to dig into the Google analytics of the OEC.” Cesar said he was just filling time happily seeing what he knew was significant growth in traffic. But he noticed something about this new traffic that would change everything.
“The traffic was all going to the little page, you know, that this GOOGLE guy had told us to build.” Users wanted to see profiles of the latest data and were less interested in making custom visualizations. Cesar got his team Dave and Alex together back in Cambridge and they decided to completely redesign the OEC. “We decided to design the site around what users saw first: the country and product profiles. We completely flipped the website.” Cesar says.
The 2015 version of the OEC set Datawheel on the track to where it is today. Datawheel entered a major contract to build DATA USA in partnership with Deloitte, building on the idea of profiles they had recently developed at the OEC. Cesar says he is most proud of how Economic Complexity and the use of sophisticated visualizations of world trade has transformed economic development reporting.”In 2011, having colorful online visualizations in an international development report was unheard of. Today, it is almost a standard practice.”
In 2018 the OEC began a transformation into a freemium model. The idea was to create new data pipelines for the latest trade data that would be put behind a paywall. The historical data that the OEC always made available remained free, but the latest numbers had a value that could help support the cost of running a website that had become increasingly complex. In June of 2021 the freemium version of the OEC was released, and today, the OEC has a real customer base and growing revenue. When the Ukraine war broke, the OEC was one of the few places to get trade data to gauge the sudden changes in trade patterns. The OEC was no longer a grad student product, but a staple of the global information ecosystem.
Today Datawheel, the company behind the OEC in dozens of other projects, like Data USA and Data Mexico, is double what it was in 2018. Headquartered in Cambridge Massachusetts, co founder and CTO Alex Simoes and CEO and co founder Dave Landry head up the management team Datawheel’s largest operation is in Concepcion, Chile, but there are also people in Buenos Aires, Sao Paulo, Washington DC, and Paris. Cesar today lives in the southwest of France, in Toulouse, making a total of 27 employees.
Alex Simoes says what makes him particularly gratified is a little game he coded during the pandemic called TRADLE where you have to guess a country based on a visualization of its exports. It was a simple task that immediately exploded in popularity. “Tradle makes up a huge chunk of the traffic and it has Its own fans, its own audience,” says Alex.“We get sweet and beautiful love letters to our email saying, "I use TRADLE in my classroom every day. " I use this with my 10th graders.”
For Cesar Hidalgo, now a professor in Toulouse with affiliations at other Universities in Europe, he comes back to the original vision that got him into physics: curious minds working quietly in observatories looking at anything that inspires wonder.
“I come from the natural sciences, and even though I've been working in economics for more than 15 years now, I keep that sense of awe that natural scientists like to have. The idea that science is not only about theories and numbers, but that it comes from a sense of wonder about nature. Like when you are walking in the forest and wondering why the leaves of a certain tree are organized the way they are. It's about thinking that there's something larger than you that you're trying to approach. For me, it’s a little bit of that, you know, just not telescopes or microscopes. I look through data scopes without losing that sense of wonder. You never really know what you are going to find.”
Cesar inspires his employees, and his team maintains enough awe about their mission that no one seems tempted to jump to Google, Meta or Apple. The management team says they are working on “a thousand new features,” some in the pipeline involving AI and other forecasting tools. There are currently more than three quarters of a million unique users of the OEC each month. It's a sign that the OEC is, in the end, a tool for democratizing economic policy. Building complexity is key to building a robust and fair economy. Economies that depend on a few natural based products make it easier for authoritarian rulers to seize control.
So, happy 12th year for the OEC. Pulling an all-nighter for the team at Datawheel was a fun throwback and a lesson for me. It's an optimistic story about how slow and steadfast growth that emphasizes learning and puts wisdom before wealth probably means the OEC will be around for at least another dozen years.
Ty Vaughan is a former fellow at the MIT Media Lab and a freelance writer based in Michigan