Multidimensional Economic Complexity and Inclusive Green Growth
Metrics of economic complexity are used routinely by international organizations, national ministries, and regional development agencies to explain international differences in inclusive green growth. But the metrics of economic complexity used commonly in these international comparisons are based on trade data, which while being internationally comparable, has the disadvantage of favoring countries that are close to advanced economies. That is, trade-based metrics can overestimate the economic complexity of countries integrated into the value chains of sophisticated neighbors (e.g., Slovakia) and underestimate the complexity of countries that are geographically distant to global markets (e.g., Australia).
Metrics of economic complexity are used routinely by international organizations, national ministries, and regional development agencies to explain international differences in inclusive green growth. But the metrics of economic complexity used commonly in these international comparisons are based on trade data, which while being internationally comparable, has the disadvantage of favoring countries that are close to advanced economies. That is, trade-based metrics can overestimate the economic complexity of countries integrated into the value chains of sophisticated neighbors (e.g., Slovakia) and underestimate the complexity of countries that are geographically distant to global markets (e.g., Australia).
In a new article, published in Communications Earth & Environment, we introduced a multidimensional approach to economic complexity that overcomes some of these limitations. We combined data on exports by product, patents by technology, and research papers by scientific field to estimate three independent metrics of complexity for 100+ countries and used these metrics to explain international variations in economic growth, income inequality (Gini index), and the intensity of greenhouse gas emissions (emissions per unit of GDP). We found that the multidimensional approach significantly improves the ability of these methods to explain inclusive green growth, but also, found that these three metrics combined differently for each of these outcomes.
Four key findings of our research were:
1. The three metrics of complexity complement each other.
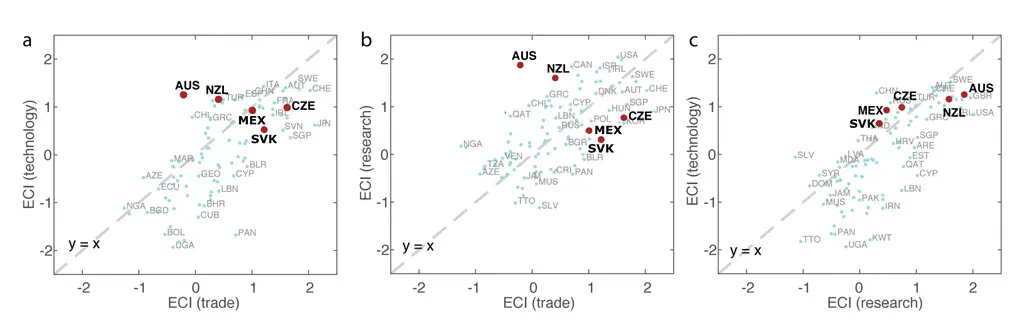
Trade data misses key aspects of the complexity of economies that can be partly recovered using data on patents and research. To understand this, consider Slovakia and Australia.
In 2021, Slovakia ranks high in trade complexity (#19), but drops respectively, to #43 and #67 in the technology and research rankings. This could be explained in part by the fact that Slovakia's exports involve plenty of innovations that are not homegrown. This is related to the fact that Slovakia's exports do not serve global markets, but the value chains of the European Union, which represents over 80% of Slovakia's exports.
Australia shows the opposite pattern. The country, a major exporter of Iron Ore, Coal, and Gas, ranks relatively low in trade complexity (#76). But Australia is a global leader in technology (#13) and research (#4). This can be explained in part by the fact that Australia is far from global markets, specializing in sourcing raw materials to China, its main trade partner, which is more than 7000 kms away.
Thus, metrics of technology and research complexity capture information about the complexity of an economy that escape trade-based measures of complexity, improving the ranking of undervalued economies and curtailing those overvalued by trade.
2. Trade and Technology complexity combine to explain economic growth.
But how do these metrics combine to explain economic growth? The early days of the literature on economic complexity were built on its ability to explain future economic growth.1,2 If multidimensional complexity really provides a better way to estimate the complexity of an economy, that should be expressed in an improved ability to forecast economic growth.
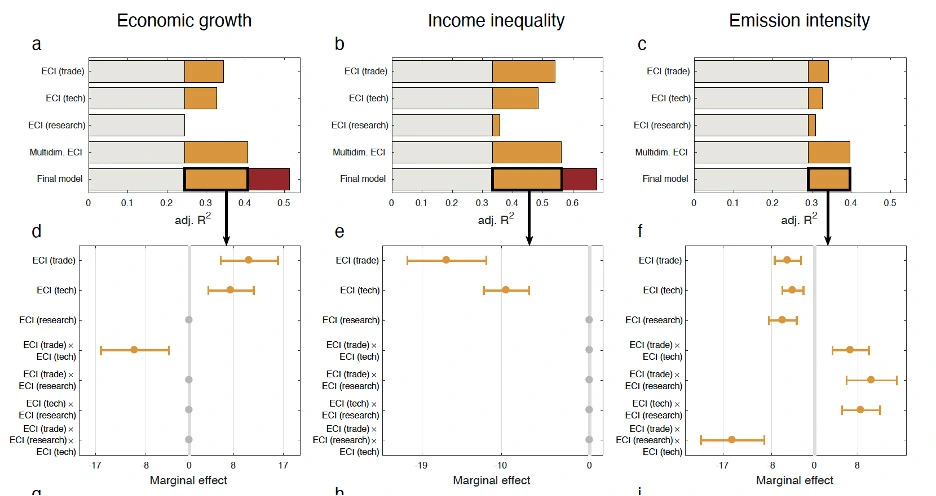
Using various models, we found that trade and technology combine to predict the 10-year annualized economic growth of a country better than trade measures of complexity alone. How much better? About 7 percentage points better in R-squared. Research complexity, however, does not have a statistically significant impact.
The best model we found includes an interaction between trade and technology complexity. In this model, trade and technology have a positive impact on growth, but their interaction term is negative, suggesting a substitute relationship. In general, countries with larger trade complexity than technology complexity experience higher growth, but countries that score poorly in both dimensions experience lower growth.
3. Trade and Technology complexity also combine to explain income inequality.
In 2017, in a paper published in World Development3, we showed that economic complexity explains international variations in income inequality. Higher complexity was correlated with lower inequality. So, it was natural to explore whether trade and technology complexity also work as predictors of the international differences the Gini index, a standard measure for income inequality. We found that, again, trade and technology complexity combine to explain income inequality better than trade complexity alone. This time, the improvement on the model was more modest (only 2 to 3 percentage points), but this is understandable also because trade complexity models already explain more than 50% of the variation in income inequality. Research complexity, however, provides limited explanatory power. This time, there is no interaction between trade and technology complexity, meaning that the two complexities do not behave as substitutes, but also, do not reinforce each other. Overall, countries that score high in both dimensions have lower income inequality.
4. Countries that score high in all three metrics have lower emission intensities.
Emissions are a more recent outcome that can be explained by economic complexity and that has received substantial attention in recent years.4-7 This time, trade, technology, and research complexity complement each other in their ability to explain greenhouse gas emission intensity. That is, we find that low emission intensity economies score high in all three dimensions. This result, though, holds only for production emissions, as the model does not work on consumption emissions (production corrected for trade). This is because economic complexity measures are based on outputs that lack information on consumption patterns.
But what do these results mean?
On the one hand, product exports and patent applications can be easily tied to monetary outcomes such as economic growth or income inequality (e.g., product exports generate revenues, whereas patents can generate both royalties and products). Thus, products and patents should be linked to pecuniary outcomes, unlike the geography of research papers, which may produce knowledge that may not be easily productized or monetized. Emission intensities, on the other hand, seem to correlate negatively with the presence of complexity in trade, technology, and research, suggesting that countries with lower emissions are sophisticated across all three dimensions. For instance, Australia's high emission intensity can be explained by its lack of sophistication in exports, since they do extremely well in the other two metrics. Yet, we should also expect Australia's emission intensity to be relatively low compared to countries with a similar export structure because of Australia's high complexity in technology and research.
These results help improve strategic economic diversification and development efforts, as they provide a more holistic target than the one provided by metrics of trade complexity alone. Putting the multidimensional economic complexity idea together suggests a more comprehensive landscape for strategic economic development, balancing multiple targets (growth, inequality, emissions) and opportunities (products, patents, and research). This should be of interest to policymakers using complexity metrics for inclusive green development and reinforce the idea that metrics of economic complexity go beyond measures of trade sophistication.
You can explore the 2021 Multidimensional Economic Complexity Rankings on the rankings page.
The actual paper about Multidimensional Economic Complexity can be found on the publications page.
References
- Hidalgo, C. A. & Hausmann, R. The building blocks of economic complexity. Proc. Natl. Acad. Sci. 106, 10570–10575 (2009).
- Hidalgo, C. A. Economic complexity theory and applications. Nat. Rev. Phys. 3, 92–113 (2021).
- Hartmann, D., Guevara, M. R., Jara-Figueroa, C., Aristarán, M. & Hidalgo, C. A. Linking economic complexity, institutions, and income inequality. World Dev. 93, 75–93 (2017).
- Romero, J. P. & Gramkow, C. Economic complexity and greenhouse gas emissions. World Dev. 139, 105317 (2021).
- Boleti, E., Garas, A., Kyriakou, A. & Lapatinas, A. Economic complexity and environmental performance: evidence from a world sample. Environ. Model. Assess. 26, 251–270 (2021).
- Can, M. & Gozgor, G. The impact of economic complexity on carbon emissions: evidence from France. Environ. Sci. Pollut. Res. 24, 16364–16370 (2017).
- Neagu. The Link between Economic Complexity and Carbon Emissions in the European Union Countries: A Model Based on the Environmental Kuznets Curve (EKC) Approach. Sustainability 11, 4753 (2019).